In recent years, rental prices have increased exponentially, with renters spending, on average, 29% of their annual salary on property rent. The number of properties occupied by private renters has been increasing gradually since 2000 which is potentially great news if you’re a landlord.
About a fifth of families in the UK currently rent rather than own their property. With the future of property uncertain, experts at Inventory Base have produced a report analysing the current state of the renting and buy-to-let market for both tenants and landlords.
Read on to discover our findings.
Key Findings
- English renters spend, on average 29.6% of their yearly income on rent, representing a slight decrease of 1.33% when compared to 2021.
- Those residing and working in Worcester had the smallest disparity between annual income and money spent on rent, with annual rent just 19.9% of annual income.
- Newcastle provides the highest rental yield of any city in England, with an estimated return of 7.2%.
City Analysis
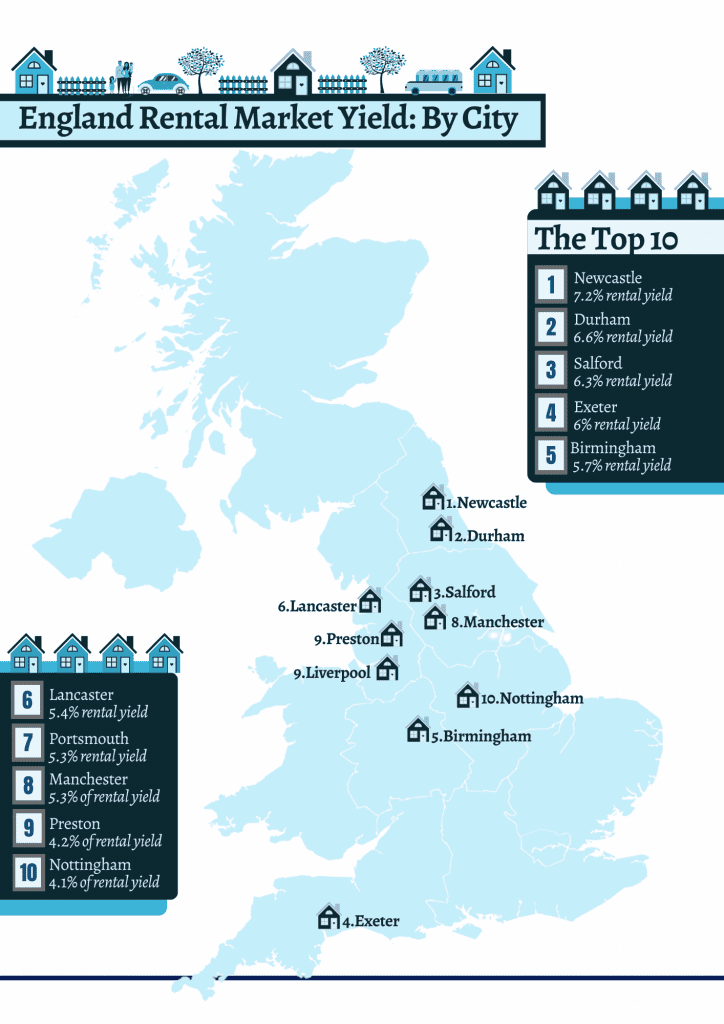
Highest Rental Yield by City: Mapped

| City | Average Rent Per Month | Average House Price | Estimated Rental Yield (%) |
| Newcastle | 1200 | 199 110 | 7.2 |
| Durham | 1100 | 200 103 | 6.6 |
| Salford | 1300 | 247 191 | 6.3 |
| Exeter | 1600 | 320 746 | 6 |
| Birmingham | 1200 | 254 425 | 5.7 |
| Lancaster | 867 | 192 685 | 5.4 |
| Portsmouth | 1200 | 271 528 | 5.3 |
| Manchester | 1250 | 283 131 | 5.3 |
| Preston | 800 | 183 236 | 4.2 |
| Nottingham | 1000 | 235 158 | 4.1 |
According to our data, rental yield is currently highest in Newcastle, with an estimated rental yield of 7.2%. Durham, Salford, and Exeter also ranked highly.
Lowest Rental Yield by City
| City | Average Rent Per Month | Average House Price | Estimated Rental Yield (%) |
| Winchester | 1175 | 605 688 | 2.3 |
| Worcester | 550 | 265 477 | 2.5 |
| St Albans | 1575 | 642 688 | 3 |
| Bath | 1500 | 589 242 | 3.1 |
| London | 1945 | 711 862 | 3.3 |
| Plymouth | 628 | 228 249 | 3.3 |
| Lichfield | 975 | 334 106 | 3.5 |
| Leicester | 800 | 266 495 | 3.6 |
| Doncaster | 530 | 171 822 | 3.7 |
Winchester is currently the city with the lowest expected rental yield, with a gross rental yield of just 2.3%. In Winchester, rental prices are comparatively low but the average cost of buying a house is high. The majority of cities with a low rental yield are located in the south of England. Chester, Lichfield and Doncaster are the only cities north of the West Midlands to feature in this table.
Rent as a Percentage of Income by City
| City | Average Rent Per Month | Average Annual Pay | Rent as Percentage of Income (%) |
| Oxford | 2200 | 40 400 | 65.3 |
| St Albans | 1575 | 32 100 | 58.9 |
| Exeter | 1600 | 33 100 | 58 |
| Brighton | 1555 | 36 300 | 51.4 |
| Bath | 1500 | 35 300 | 51 |
| Cambridge | 1900 | 46 900 | 48.6 |
| Chichester | 1350 | 33 800 | 48 |
| Bristol | 1500 | 38 300 | 47 |
| Canterbury | 1200 | 30 900 | 46.6 |
Residents of Oxford spend the largest proportion of their monthly salary on rent, with a property costing, on average, £2200 per month. Residents of St Albans and Exeteralso spent an extortionate amount on rent. 2022 represents the largest increase in average rental costs in five years.
In the last 12 months, rent has increased by more than 2% for millions of tenants across the UK. In Manchester, rental prices have increased by a jaw-dropping 23.4% in the last year alone again making it a potentially good option for landlords to consider.
Who spends the least on rent each year?
| City | Average Rent Per Month | Average Annual Pay | Rent as Percentage of Income (%) |
| Worcester | 550 | 33 200 | 19.9 |
| Doncaster | 530 | 30 700 | 20.7 |
| Stoke-on-Trent | 550 | 31 800 | 20.8 |
| Carlisle | 538 | 30 400 | 21.2 |
| Derby | 738 | 40 500 | 21.9 |
| Sunderland | 595 | 29 200 | 24.5 |
| Plymouth | 628 | 29 800 | 25.3 |
| Wakefield | 735 | 34 700 | 25.4 |
| Bradford | 675 | 31 700 | 25.6 |
| Hull | 595 | 27 900 | 25.6 |
Residents of Worcester currently spend the smallest portion of their monthly salary on housing, with rents costing, on average, just 19.9% of their monthly salary. Doncaster, Stoke-on-Trent and Carlisle are also excellent options for families looking to rent.

